
Reading time: 10 minutes
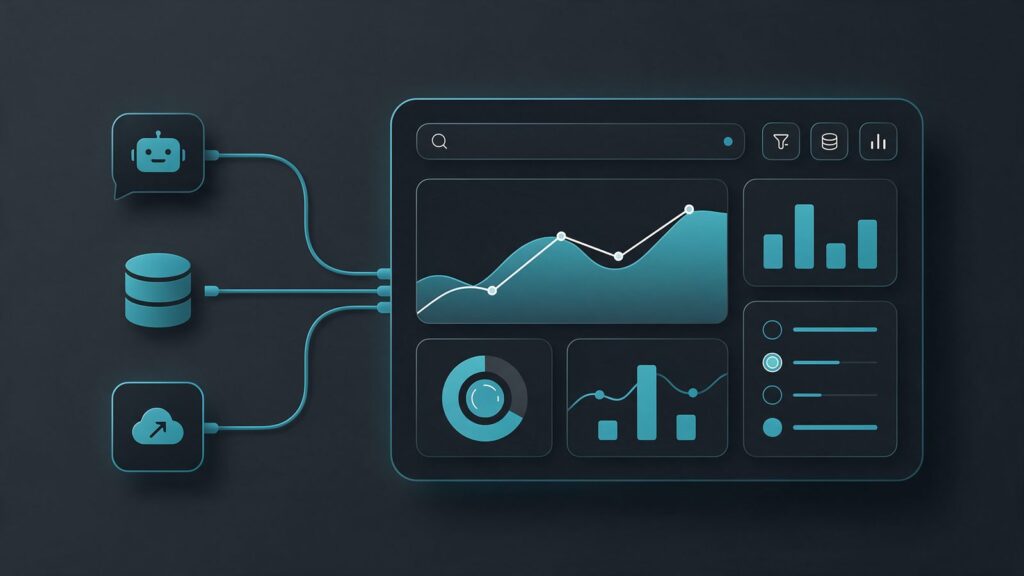
An SEO dashboard template in Data Studio, formerly Looker Studio, puts GA4 and Search Console data on one screen. In addition, it gets a page for AI visibility. This template shows the connectors, fields, filters and charts for each page. It also shows what you add by hand, because AI impressions and citations have no connector.
In short
- The template has four pages: overview, Google Search, site and conversions, and AI.
- GA4 and Search Console have native connectors, but AI impressions and Bing citations arrive through exports.
- The GA4 AI Assistant channel comes through the connector, while clicks from AI Overviews stay in organic search.
- On a standard GA4 property, the API quota is 200,000 tokens per day, and a heavy dashboard can use it up.
How do you build an SEO dashboard in Data Studio?
Build the Data Studio dashboard in four pages, each with one question. The first page shows what changed. Then the others cover Google Search, the site and the AI answers. That way, each page uses one main source. Also, a date range control at the top applies to the whole dashboard.
| Page | Main source | Charts |
|---|---|---|
| Overview | GA4 and Search Console | Scorecards for clicks, sessions and key events |
| Google Search | Search Console | Clicks and impressions over time, queries and pages |
| Site and conversions | GA4 | Sessions and key events by channel and page |
| AI | GA4 and spreadsheet | AI channel, AI impressions, citations and presence |
The dashboard updates the data on its own, but it doesn’t explain what changed. So the order of the sections and the reading of each number belong in the SEO report for clients. The metrics on each page, in turn, come from the digital marketing KPIs that leadership already tracks.
Looker Studio or Data Studio?
It’s the same product with a new name. In April 2026, Google renamed Looker Studio to Data Studio, according to the tool’s release notes. As a result, the docs and menus already use the new name. However, people still search for “Looker Studio”. That’s why this guide uses both names. The SEO dashboard described here works the same way in Data Studio.
How do you connect GA4 and Search Console to the SEO dashboard?
In the Data Studio dashboard, each tool becomes a data source. On the Data Studio home page, click Create and select Data Source. Next, select the connector, authorize access, choose the property and click Connect. Finally, add the sources to the same report with the Add to report button.
However, Search Console needs one extra choice. According to the Search Console connector help, a data source uses the Site Impression table or the URL Impression table, never both. So create two sources: the site one for totals and queries, and the URL one for pages. Google itself uses URL Impression in its own dashboard template.
For GA4, the Google Analytics connector brings in any field from the Data API, including custom ones. But GA4 segments and comparisons don’t come through the connector.
Also, set the credentials. With owner’s credentials, the client sees the dashboard without access to GA4 or Search Console. They also save quota, as the last section shows.
Which fields go on each page?
Use few fields per page, because each GA4 chart uses quota. The table shows the core fields of the SEO dashboard template and where each one goes.
| Field | Source | Where it goes |
|---|---|---|
| Query | Search Console (site) | Query table, branded and non-branded |
| Landing Page | Search Console (URL) | Page table |
| Clicks, impressions and CTR | Search Console | Scorecards and time series |
| Session default channel group | GA4 | Sessions by channel, including AI |
| Sessions and engagement rate | GA4 | Scorecards and time series |
| Key events | GA4 | Conversions by channel and page |
Which filters and controls does an SEO dashboard need?
An SEO dashboard needs four pieces: a date range control, a data control, an organic search filter and a branded query split. As a result, one Data Studio dashboard serves many clients and compares equal periods in both sources.
- Date range control: one control filters charts from different sources, each by its own date field. The Google Analytics connector uses the last 28 days by default.
- Data control: the viewer switches the GA4 or Search Console property without editing the report. They only see the accounts they can access. So the agency keeps one template for every client.
- Organic search filter: in Google’s dashboard, the GA4 data only includes sessions with source google and medium organic.
- Blank queries: Search Console hides rare queries and queries with personal data. The connector groups them into one blank row. Then, exclude null values from Query.
To split out your brand, create a calculated field with the REGEXP_MATCH function. For example: CASE WHEN REGEXP_MATCH(Query, ".*(mybrand|my brand).*") THEN "Brand" ELSE "Non-brand" END. However, be careful with the regular expression filter. According to the filter conditions help, Regexp Match needs the whole value, while Regexp Contains looks for a part.
How do you show AI traffic in the SEO dashboard?
Use the GA4 Session default channel group field and filter for the AI Assistant value. According to the GA4 help, the channel covers visits from sources like ChatGPT, Gemini, Copilot and Grok. On the AI page, show the channel’s sessions and key events month by month.
However, the channel has two limits. First, it has only existed since May 2026. Second, it excludes AI Overviews and AI Mode, whose clicks stay in Organic Search. Therefore, don’t add the AI channel to organic search, and don’t treat it as the full effect of AI.
For history, create a custom channel group in GA4 with an AI rule. The connector help doesn’t mention these groups. Still, it says the connector brings in Data API fields, and the API supports custom groups. So the group should show up as a field in the GA4 source. Check your source before you build the chart. The rule, the AI sources and why ChatGPT lands in more than one channel are in the guide to AI traffic in GA4.
A calculated field for key events per session shows the conversion rate by channel, including the AI channel.
How do you add AI mentions and citations to the SEO dashboard?
Through a spreadsheet. AI mentions, citations and impressions have no native connector. Search Console shows AI impressions, and Bing shows Copilot citations. Your prompt tracking, in turn, shows brand presence. So export each data point every month, paste it into Google Sheets and connect the sheet to the dashboard.
In fact, both official reports need a manual export. The generative AI performance report has an export button, but the Search Console connector doesn’t list an AI search type. Similarly, the Search Console API documentation doesn’t list a generative AI data type. The guide to AI Mode and AI Overviews data in Search Console covers this limit.
For Bing, the AI Performance help mentions exports in CSV and Excel. However, the Bing API doesn’t list methods for citations, according to the guide to the Bing AI Performance report.
How should you organize the AI spreadsheet?
Use one tab per source, with a single header row and the same data type in each column. The Google Sheets connector links one worksheet per data source. In addition, it refreshes every 15 minutes by default.
| Tab | Columns | Origin |
|---|---|---|
| AI impressions | Month, page, impressions | Search Console export |
| Bing citations | Month, page, citations | Bing export |
| Prompts | Date, engine, prompt, brand named, site cited | Your own tracking |
With competitors in the same tab, the dashboard can also calculate AI share of voice for each month. The tracking follows the protocol to measure brand mentions and citations in AI, with fixed prompts and a margin of error. In the chart, show each number on its own scale. In other words, don’t add up impressions, citations and visits.
Is there a ready-made SEO dashboard template?
Google has templates for GA4 and Search Console, but none with an AI page. Google publishes a dashboard template that joins both sources. Also, the Data Studio gallery has a Search Console category. So a ready-made SEO dashboard template works as a base, and you add the AI page by hand.
Google’s SEO dashboard template is in the Search Central guide on Search Console and Google Analytics. It uses five metrics: sessions, engagement rate, returning users, clicks and CTR. To use it, click Use my own data and connect each source. According to Google, though, the goal is to spot traffic changes quickly, not to dig into the data.
Therefore, an agency should build its own SEO dashboard template with the four pages. Any report becomes a template when you add /preview to the end of its URL. Then, with a data control, each client sees only their own accounts. Google’s templates, by the way, are only available in English.
When does Data Studio stop being enough?
Data Studio stops being enough in three cases: a used-up GA4 quota, analysis that joins queries and sessions, and blends with more than five sources. In these cases, export the data to BigQuery and connect the dashboard to it.
First, watch the GA4 quota. In the GA4 Data API documentation, a standard property gets 200,000 tokens per day and 40,000 per hour. The Data Studio troubleshooting guide lists what to do when it runs out:
- use owner’s credentials, so viewers share the cache;
- merge duplicate GA4 sources into one reusable source;
- reduce the number of charts per page;
- extract the data into a static snapshot;
- export GA4 to BigQuery.
Blends have limits too. According to the help on blends, each blend joins up to five tables and only exists in the report where you created it. For query-level data, on the other hand, Google recommends BigQuery, with the Search Console bulk export and the GA4 export.
Finally, a Data Studio dashboard shows numbers, not return. To turn those numbers into revenue, see how to calculate SEO and GEO ROI.
Frequently asked questions
Search Console data refreshes in Data Studio every 12 hours, according to the tool’s help. Google Sheets, on the other hand, refreshes every 15 minutes by default. In addition, report editors can refresh the data by hand at any time.
Yes. Data Studio can schedule an email with a PDF of the report, at the frequency you choose. The PDF can include a link to the original report. To create the schedule, you must be an editor or owner of the report, or have scheduling permission.
Because Data Studio matches the standard GA4 reports, not the explorations. Also, GA4 can apply sampling to queries with a lot of data, and Data Studio doesn’t show when data is sampled. So always compare the same period and leave today out of the comparison.
Main sources
- Data Studio, release notes, with the Looker Studio name change (2026).
- Data Studio, connect to Search Console (2026).
- Data Studio, connect to Google Analytics 4 (2026).
- Data Studio, troubleshooting guide and GA4 quota (2026).
- Google Search Central, using Search Console and Google Analytics data for SEO (2026).
- Google Analytics Help, default channel groups (2026).
- Search Console Help, generative AI performance report (2026).
- Bing Webmaster Tools Help, AI Performance in Bing Webmaster Tools (2026).