
The right report, at the right time, for the right audience.
NotHuman delivers the summary the board understands, the analysis managers use and the ticket list the dev team works through. The report updates itself, with KPIs and periods built for your business, so nobody decides on noise.
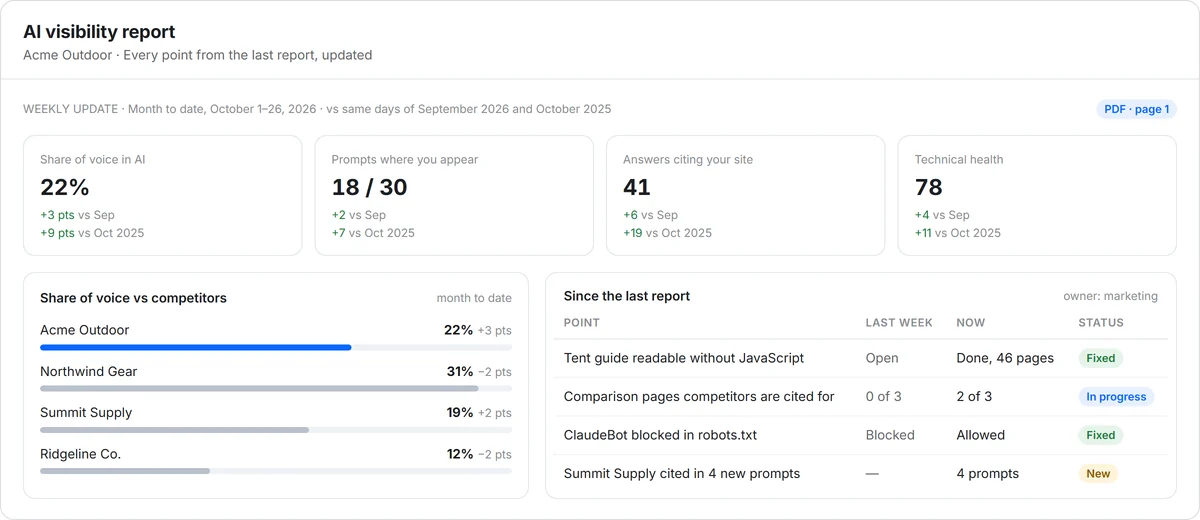
Each audience reads the part it needs.
Each module generates one report with two files that come out together: the PDF, short enough for the meeting, and the Excel, with every detail for the people who act on it.
Board and C-level
The first page of the PDF: what changed in the period and what comes next.
- The right KPIs for the period
- Comparison with the previous period and last year
- Next steps with an owner
Managers
The full PDF, with the analysis of each topic and the progress since the last report.
- Competitors, content and technical health
- What happened to each point from the last report
- Priorities for the next period
Dev team
The Excel that comes with the PDF, with one row per item to fix.
- Affected URL, evidence and how to fix
- Sorted by priority
- Status of what is already fixed
The report you need, for every decision.
A dip in the middle of the week can be seasonality, a holiday or just the normal swing between days. In a weekly meeting, you need to know what to look at and what to bring: the trend of the month, not the noise of a few days. That is why every report brings the period and the comparison that make sense for the decision. Change the period, and the KPIs, charts and cards change with it.
Weekly
- Shows
- The month so far and the past week
- Compares with
- The same days of the previous month and of last year
- Good for
- Correcting course without reacting to noise
Monthly
- Shows
- The closed month and the trend
- Compares with
- The previous month and the same month last year
- Good for
- The meeting with your manager
Quarterly
- Shows
- The quarter and the year so far
- Compares with
- The last quarter and the same quarter last year
- Good for
- Planning the next quarter
Seasonal
- Shows
- A campaign or date, like Black Friday
- Compares with
- The same date in previous years
- Good for
- Knowing whether the campaign beat last year’s
The rhythm depends on the business. Some brands live on seasonality, some need an immediate response and some have a long cycle. The default period and comparisons are set during setup, with the GEO specialist.
The day before the meeting, the report is ready.
Weekly meeting, Monday at 9 a.m.
The report lands in your inbox at 8 a.m., with the month so far and what happened to each point since last week.
Monthly meeting with your manager
Minutes before, you generate the report for the closed month. The PDF goes to the meeting, and the Excel backs up the detailed questions.
Quarterly planning
You pull the same quarter from last year and the latest quarter. With both side by side, the plan starts from what already happened.
Black Friday
Seasonal peaks are measured against the same event in previous years, never against the month before. The report isolates the campaign window, so the result reflects performance, not the calendar.
Every report picks up from the last one.
The first report comes out right after the platform setup. From then on, each new report updates every point from the previous one and shows what happened to each. Because the platform checks your site every day, starting with the most important pages, what the team fixes today shows up in the next check.
- Period KPIs against the previous period and last year
- Each point marked as fixed, in progress or new
- Declared scope: prompts, AI engines and competitors
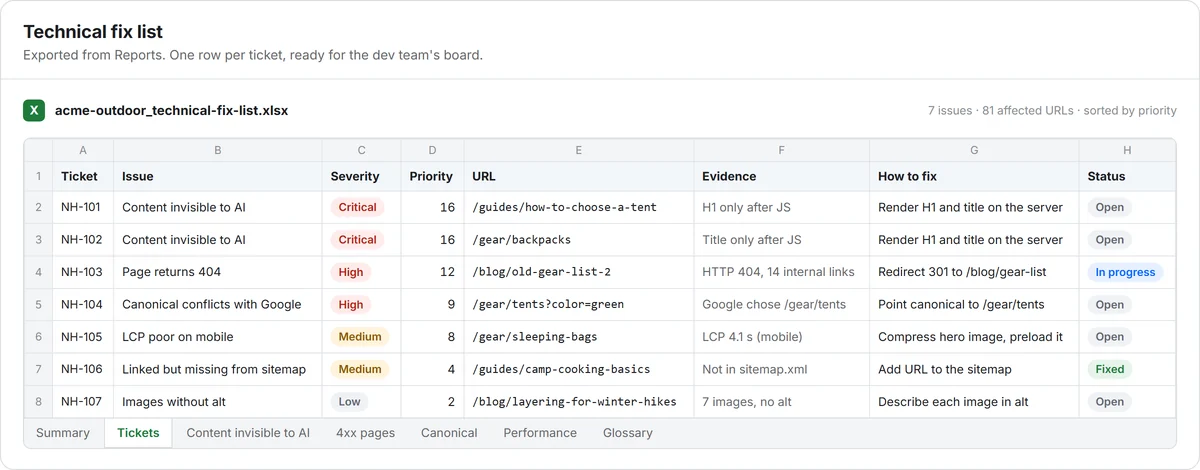
The Excel comes with the PDF.
The PDF is short enough for the meeting. The Excel brings the granularity: every URL, every prompt, every piece of evidence. In Technical, it already comes as a ticket list for the dev team.
- One row per ticket, sorted by priority
- Affected URL, evidence and how to fix
- One tab per issue and a glossary
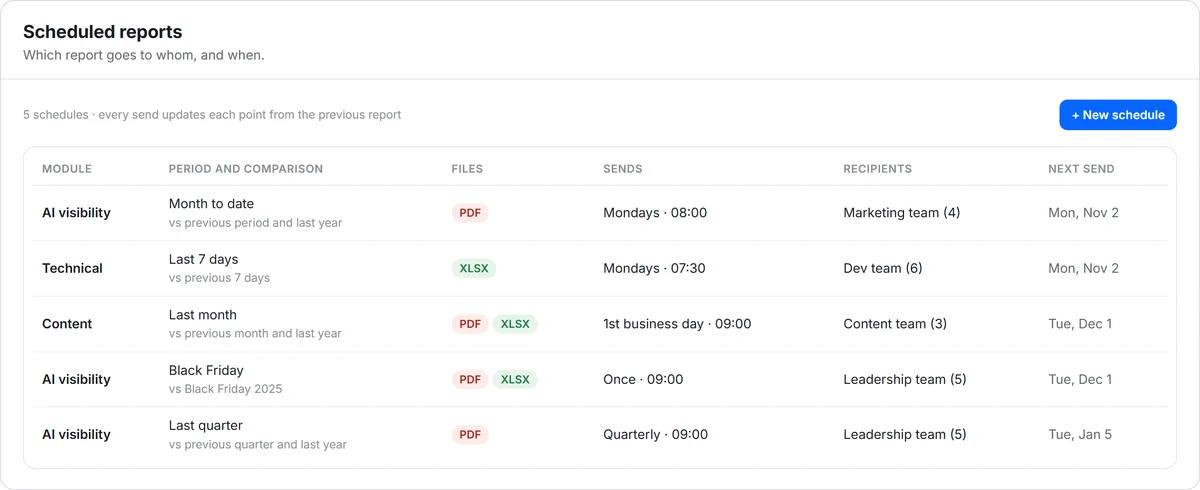
In the right inbox, at the right time.
Pick the frequency, day and time, and who gets each report. The board gets the quarterly summary, managers the monthly analysis and the dev team the weekly tickets.
- Weekly, monthly, quarterly or once
- One recipient or a group, per report
- Which module and which file goes to each person
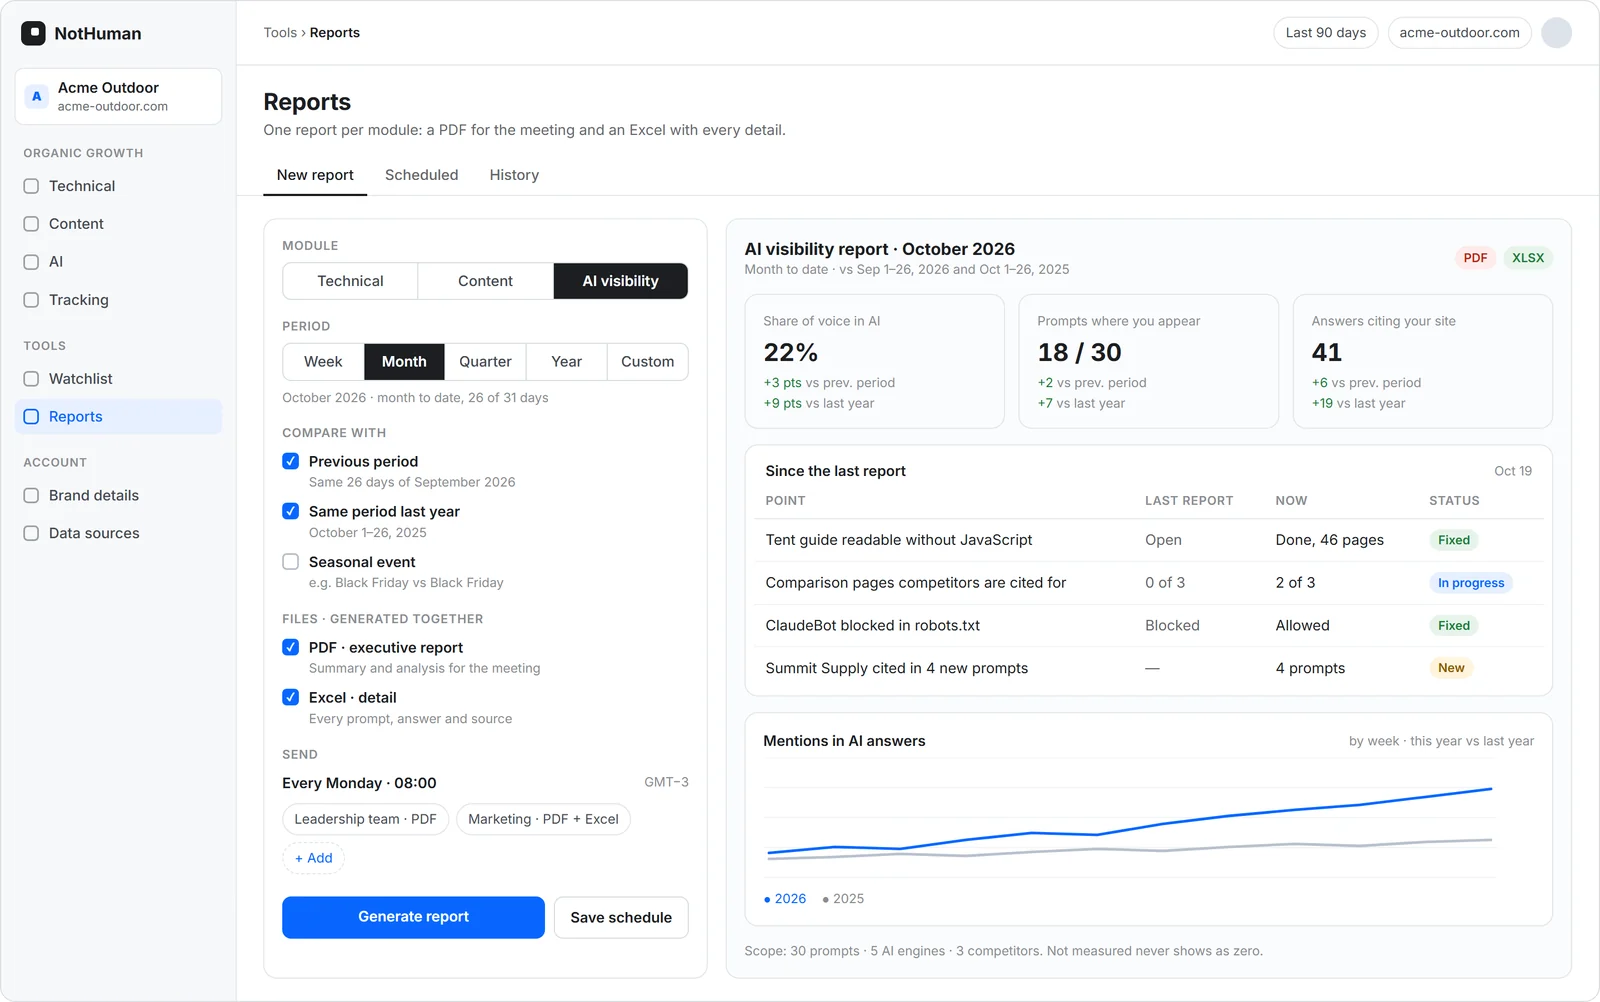
All three modules have reports.
Reporting cuts across the platform: the same format works for Technical, Content and AI Visibility.
Technical SEO
- Technical health score and trend
- Issues by severity
- Site speed and Core Web Vitals
- One row per ticket
- URL, evidence and how to fix
- One tab per issue
Content Analysis
- Content that delivers
- What grows and what gets old
- Gaps against competitors
- Page by page, with the content score
- Traffic and position for each page
- The suggested fix for each one
AI Visibility
- Share of voice against competitors
- Mentions and citations per AI engine
- Prompts where the brand appears
- Prompt by prompt, with the answer
- Who was cited and the sources
- One number per AI engine
Reports in detail.
- Modules
- Technical, Content and AI Visibility, each with its own report
- Files
- Executive PDF and supporting Excel, generated together
- Periods
- Week, month, quarter, year or custom dates
- Comparisons
- Previous period, same period last year and seasonal dates, like Black Friday against Black Friday, when there is history
- First report
- Generated right after the platform setup
- Updates
- Your site is checked every day, starting with the most important pages, and each report picks up the points from the previous one
- Delivery
- Weekly, monthly, quarterly or once, on the day and time you choose
- Recipients
- You decide who gets each report and each file
- Data sources
- Site crawl, Search Console, GA4 and AI answers measured every week
A report is only worth it if the number holds up in the meeting.
Every NotHuman report shows where each number comes from, so nobody mistakes a change in scope for a result.
Declared scope
Prompts, AI engines, competitors and period appear in the report itself.
Mentions and citations apart
Being named in the answer and having your site cited as a source are different things, and the report counts each.
One number per engine
ChatGPT, Gemini, Perplexity, Claude and AI Overview appear one by one before the total.
“Not measured” never becomes zero
When a source didn’t answer, the report says so instead of showing zero.
Frequently asked questions
What reports does NotHuman generate?
One report for each module: Technical, Content and AI Visibility. Each comes as two files generated together: the PDF, with the summary and analysis for the meeting, and the Excel, with the detail of every point.
Which period should I use in the report?
It depends on the decision. Weekly tracks how the month is going, monthly closes the month, quarterly supports planning and seasonal compares the same date across years, like Black Friday against Black Friday. The default is set during setup, based on the rhythm of the business.
Can I get the report by email automatically?
Yes. You choose the frequency, day, time, who receives it and which file each person gets. Every send updates the points from the previous report.
How does the dev team receive the fixes?
In the Excel that comes with the Technical PDF, with one row per ticket, the affected URL, the evidence and how to fix it, sorted by priority. The file also has one tab per issue and a glossary.
Where do the report numbers come from?
From the same data as the platform: the site crawl, Search Console, GA4 and AI answers measured every week. When a source didn’t respond, the report says it wasn’t measured. It never shows it as zero.
See what NotHuman finds on your site.
Start with the free diagnostic or book a demo with our team.