
Find out which pages to rewrite first.
Content Analysis gives every page a score from 0 to 100 across 11 signals that help Google and AI use your content. It combines the score with real traffic and shows where competitors rank and you don’t.
What you’ll find
The score shows what a page is missing. Traffic shows whether it is worth fixing now.
A score for every page
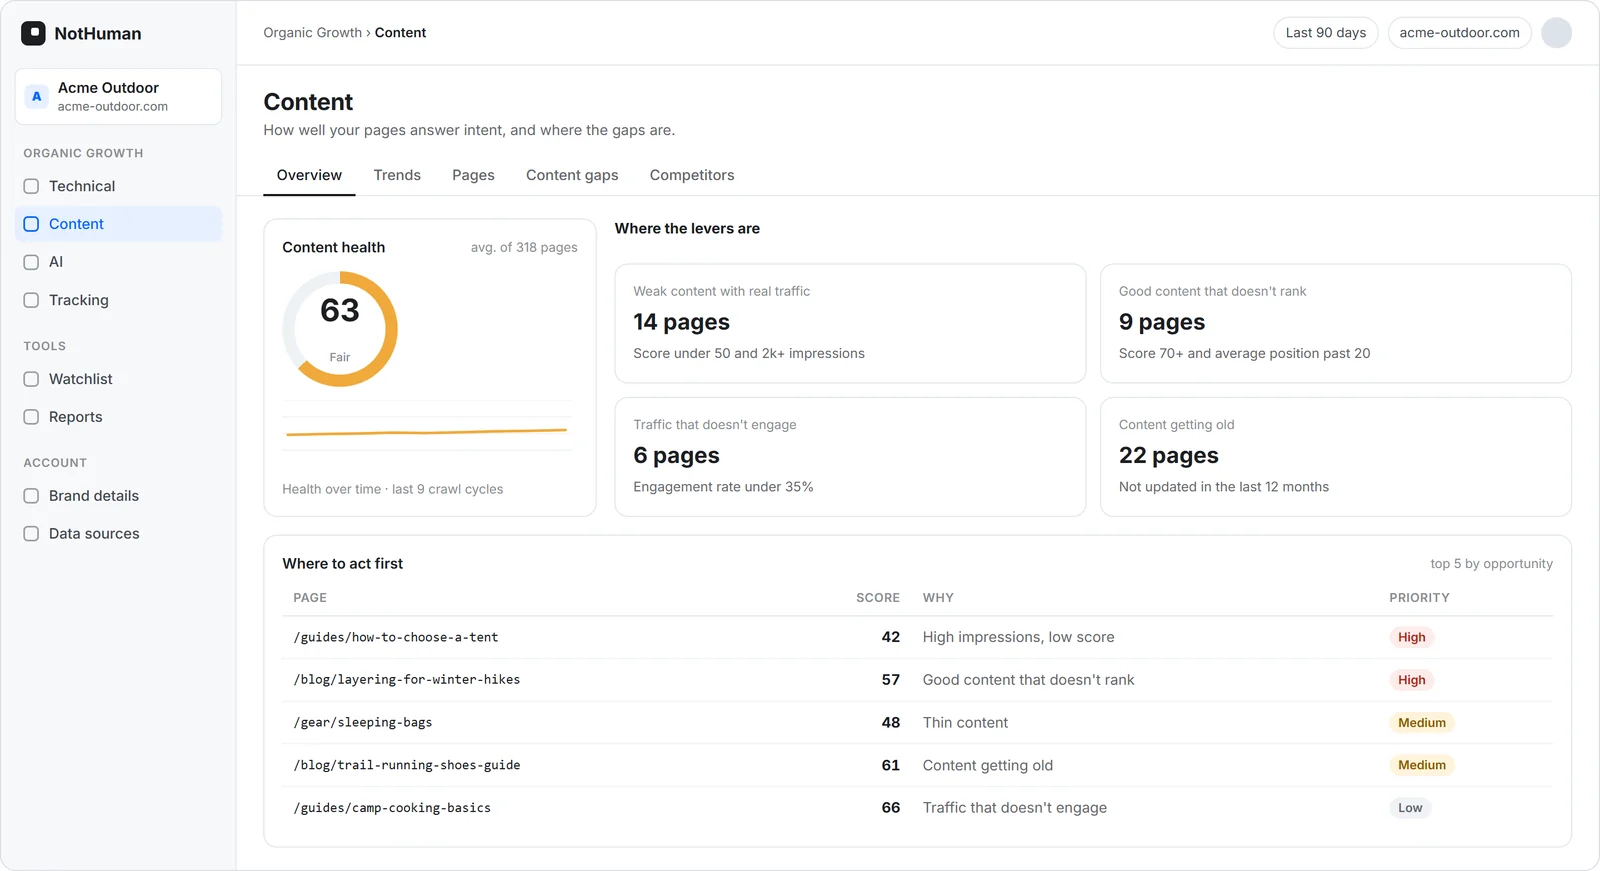
From 0 to 100, based on 11 signals such as a direct answer, author, dates, heading structure and structured data.
Where the levers are
Weak content with real traffic, strong content that doesn’t rank, traffic that doesn’t engage and content that is aging.
What’s gaining and what’s losing
Clicks, impressions and position week over week, the pages rising and falling the most, and the pages entering or leaving the rankings.
Content gaps
The keywords your competitors rank for and you don’t, with volume, difficulty and the ranking URL.
Suggested competitors
Up to 10 per run, with the reason for each suggestion. Large portals are left out.
Everything you measure, in one place
Competitors, keywords and prompts live in Tracking, with plan usage and a history of every change.
From raw data to a list of what to do.
Reads
The analysis uses the HTML the crawler has already saved and each page’s structured data, and only re-analyzes a page when it changes.
Scores
The 11 signals have public weights. The score is the sum of the signals the page meets.
Combines
The score is joined with Search Console, GA4 and competitor ranking data.
Ranks
Pages move up the list by opportunity: the lower the score and the higher the demand, the sooner they appear.
Know where to act before you rewrite.
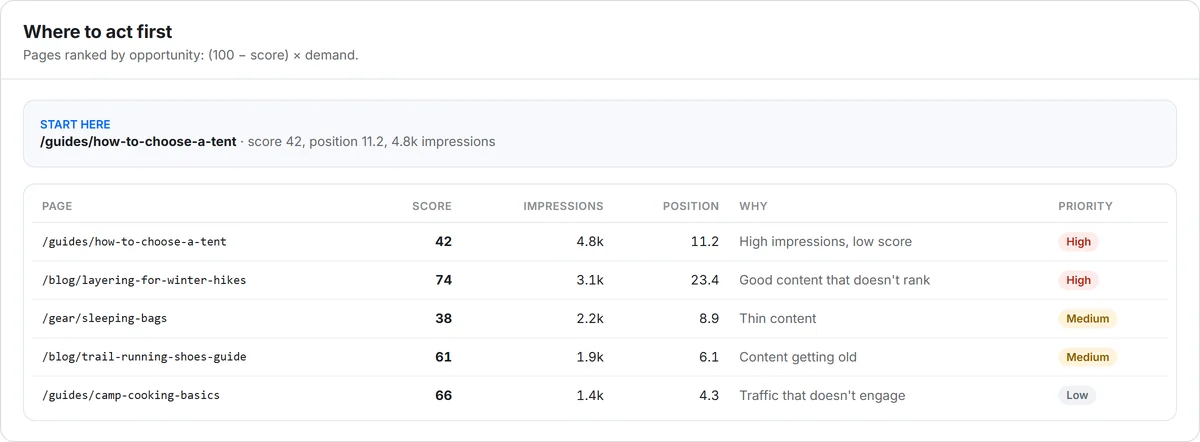
“Where to act first” shows the 5 pages with the most opportunity, each with its reason and evidence on the same line.
- High impressions and a low score
- Strong content that doesn’t rank
- Traffic that doesn’t engage and content that is aging
See what competitors rank for and you don’t.
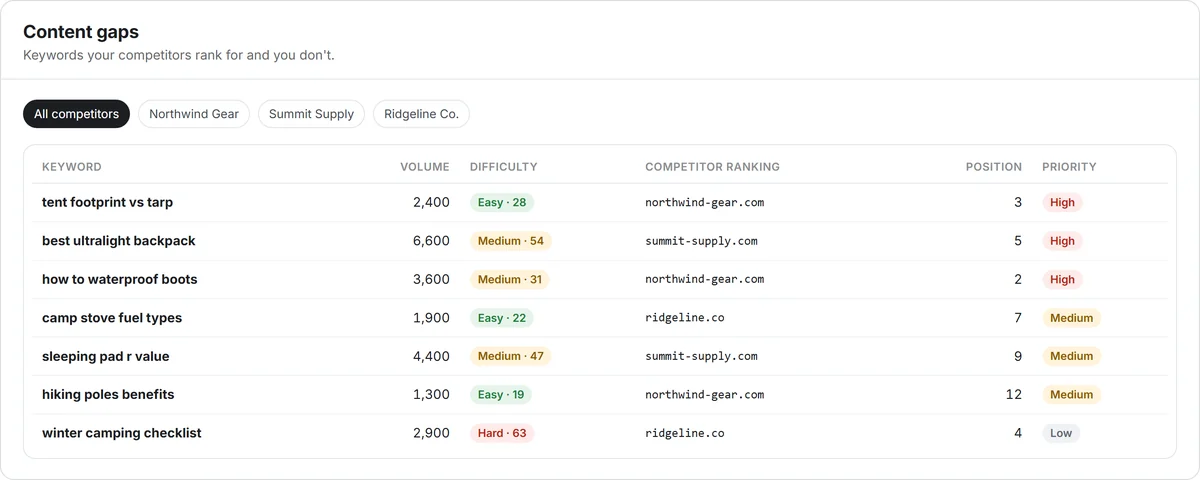
Content gaps compare your competitors’ keywords with yours and rank them by opportunity: volume, competitor position and ease.
- Domain, position and URL of the ranking page
- Up to 100 keywords per competitor
- One click sends a keyword to Tracking
Understand each page’s score.
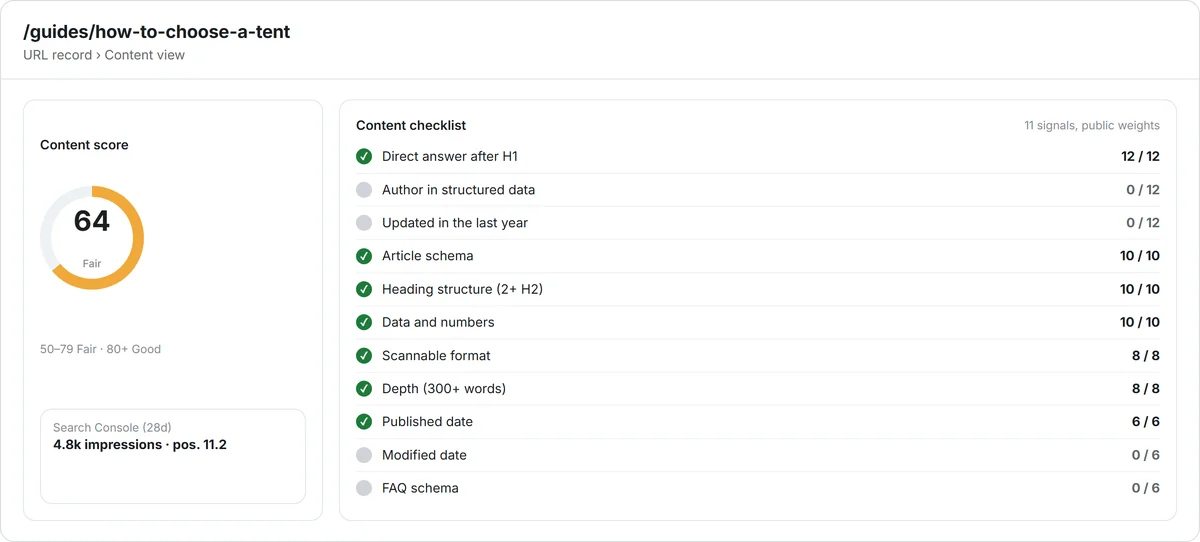
The page profile shows the score, the 11-signal checklist and traffic, next to the technical data and AI citations for the same URL.
- A checklist of what the page meets and what it’s missing
- One profile for technical, content and AI
- Site score history for every crawl cycle
The 11 signals and their weights
The score is the sum of the weights a page meets, from 0 to 100. 80 or above is good; 50 to 79 is fair; below 50 is poor.
The Content Analysis report, ready for every meeting.
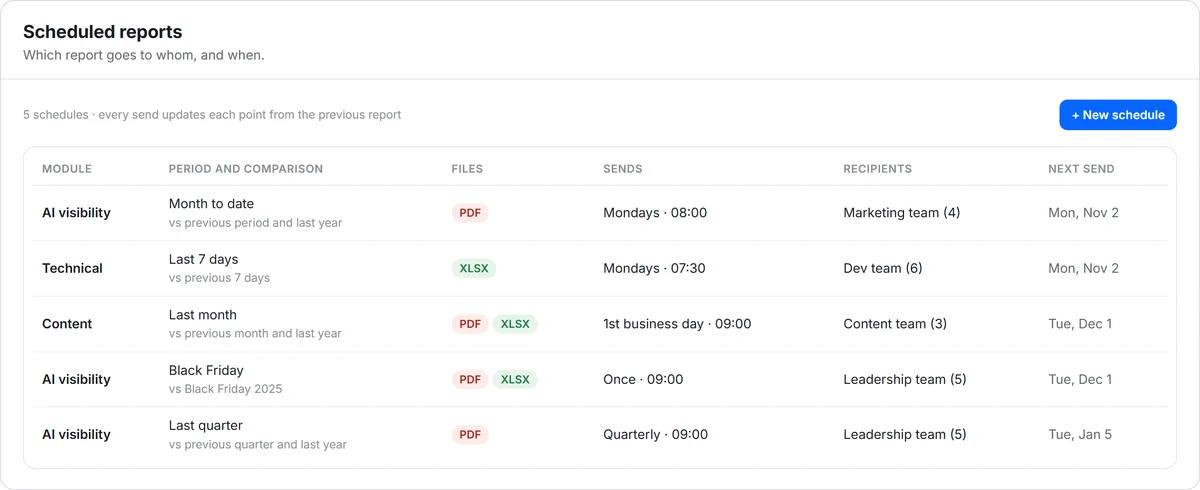
One report, two files generated together: the PDF for the meeting and the Excel with the detail. The period and comparison follow the decision, and the report is sent automatically to whoever you choose.
- Content that delivers
- What grows and what gets old
- Gaps against competitors
- Page by page, with the content score
- Traffic and position for each page
- The suggested fix for each one
Connected to your site every day
Every day the platform checks your site, starting with the most important pages. If the team fixes something today, the next check already shows the result in the report.
The right period
Weekly tracks the month, quarterly supports planning and seasonal compares the same date across years.
Auto-send
Pick the frequency, day, time and who gets each file. Every send picks up the points from the previous report.
The data shows what is happening. Your specialist helps you decide what to do.
Every plan includes a GEO specialist. They set up the platform with you, deliver the first report after one month with a roadmap, and follow your results in the meetings included in your plan.
Frequently asked questions
Do I need Search Console and GA4?
They show which pages have demand and engagement. Without them, the score is still calculated, and the lenses that depend on those sources show as “not measured.”
Does NotHuman compare my content quality with my competitors’?
No. For competitors, we compare keywords: where they rank and you don’t. The content score covers only your pages.
Is the score generated by AI?
No. It is 11 rules with public weights, applied the same way to every page. That is why the score does not assess the tone or clarity of the writing.
Which market does the competitor data come from?
Today, Brazil, in Portuguese. The analysis of your own pages works in any language.
Where do I add competitors and keywords?
In the platform’s Tracking area, which keeps competitors, keywords and prompts in one place, with plan usage and a history of every change.
See what NotHuman finds on your site.
Start with the free diagnostic or book a demo with our team.